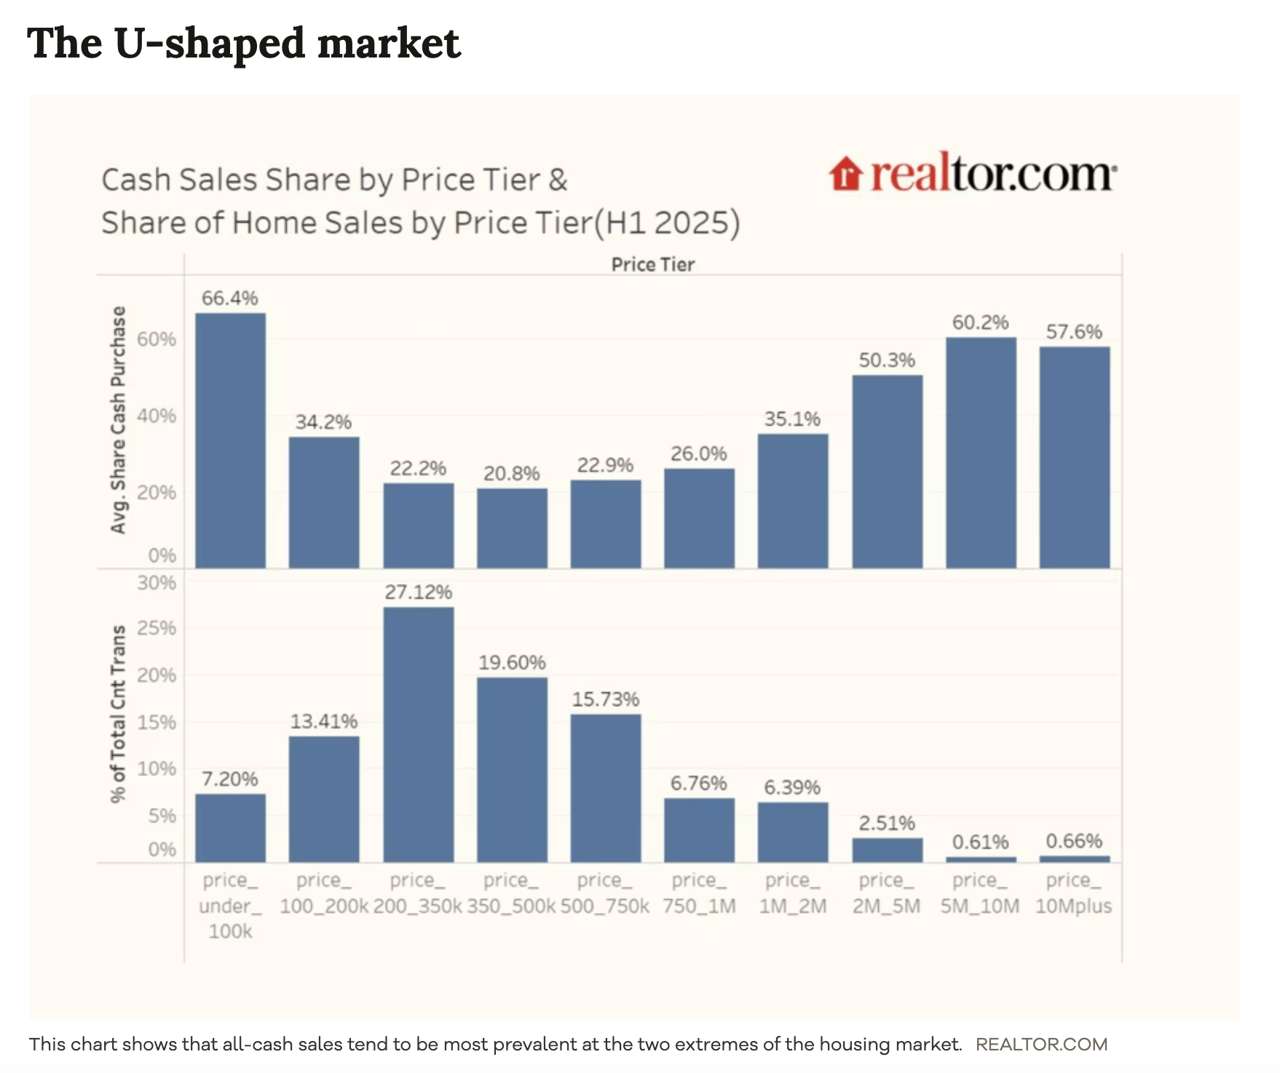
The chart “Cash Sales Share by Price Tier & Share of Home Sales by Price Tier (H1 2025)” from Realtor.com shows trends across different home price tiers in the U.S. housing market.
Key insights from the data:
U-Shaped Pattern for Cash Sales:
The percentage of homes purchased with all cash is highest among properties at the very low and the very high ends of the market. For the lowest price tier (under $100k), the average share of cash purchases is 66.4%. For the highest tiers ($2M+, $5M-$10M, $10M+), it ranges from 50.3% up to 60.2% and 57.6%.
Middle Price Tiers:
In the mid-range market ($100k–$1M), the cash sales share drops considerably, staying mostly between 20–35%.
Share of Total Transactions:
Most home sales occur in the price range from $200k–$750k, where cash sales constitute smaller percentages of the total transactions, but these tiers make up bulk of the overall volume. For instance, homes priced at $200k–$350k represent 27.12% of transactions, although cash sales here are at 22.2%.
Conclusion:
The data reflects a U-shaped trend: buyers at the bottom and top ends of the market are most likely to pay entirely in cash, while buyers in the broad middle of the market mostly use financing. This suggests that lower-priced homes may be attractive to investors or those unable to secure financing, while higher-priced homes are often purchased by wealthy buyers with access to liquid assets.